

I’ve said this many times on project sites: photometric reports are polite, well-behaved documents—almost too polite. The ground, on the other hand, usually has a mind of its own. Once you raise a luminaire to 10 meters and step back a few dozen meters, the beam starts revealing small habits you don’t always notice in a lab. Some good, some slightly annoying, all of them real.
This write-up reorganizes everything from a recent Type III optics test—not as a neat Q&A or a symmetrical SEO article, but closer to how engineers actually record things: in sequences, half-formed thoughts, a few unexpected findings, and a couple of notes I scribbled when the lux meter was giving us tiny heart attacks.
1. Why a 10-Meter Height Still Matters (Even Though Everyone Thinks They Know the Answer)
People assume 10 m is “standard,” but that’s not why I keep coming back to it.
At 8 m, Type III tends to exaggerate its hot zone—almost theatrical.
At 12 m, it starts behaving too politely again, washing out edges.
At 10 meters, the personality of the optic shows itself:
- Forward reach becomes honest—neither exaggerated nor muted.
- The lateral shoulders don’t collapse.
- Glare settles into a stable pattern (most days).
- You can compare results with old projects because half the industry coincidentally uses this height.
In other words: 10 m is tall enough to reveal the true spread, but still low enough for the ground to tell you what it thinks.
2. Test Conditions (Not the Perfect Kind—Just the Real Kind)

This wasn’t a showroom test. It was a plain outdoor site behind a construction yard, where you can still smell concrete dust from previous slab pours.
A few honest details:
- Ground surface: medium-rough concrete, slightly brighter on the east side. Uneven enough to cause small lux swings.
- Ambient: around 2–3 lux from distant street lighting. I tried to ignore it; couldn’t entirely.
- Weather: calm, though a faint breeze at 1–2 m/s moved the meter cable once.
- Equipment: standard LED module, generic lux meter, generic goniophotometer. No brand-specific tricks.
- Number of runs: three. First run had jumps—probably my fault for not leveling the meter properly.
I always include these small annoyances because they explain the little spikes in the data that clean PDFs never show.
3. How the Light Actually Fell on the Ground (Before We Get Lost in Numbers)
Before touching the data, I walked roughly 40 meters out toward the forward throw. A habit.
From that view, the Type III pattern looked familiar but with a few quirks:
- The central wedge held nicely up to around 24–26 m.
- A faint bright ridge appeared around 12–18 m—nothing dramatic, but visible.
- Left–right shoulders were smoother than I expected; maybe the pavement texture helped.
- Rear spill? Almost invisible, maybe 2–3 lux right under the pole.
- The cutoff wasn’t as sharp as the lens datasheet suggested. I wrote “softer than chart” in my notebook.
These early impressions usually tell me whether the photometric data later will make sense. This time, they matched surprisingly well.
4. Photometric Observations (The Part Everyone Jumps To First)

We set the meter grid in 5-meter intervals, forward to 40 m, lateral ±20 m. The luminaire sat exactly at 10.0 m—checked twice because the rope slipped the first time.
4.1 Horizontal Illuminance Map (Condensed)
| Forward Distance | -10 m | -5 m | 0 m | +5 m | +10 m |
|---|---|---|---|---|---|
| 0 m | 8 | 12 | 18 | 11 | 7 |
| 10 m | 14 | 22 | 35 | 24 | 15 |
| 20 m | 10 | 18 | 29 | 20 | 12 |
| 30 m | 6 | 10 | 18 | 9 | 5 |
| 40 m | 3 | 5 | 7 | 4 | 2 |
A few honest notes:
- The 35 lux central peak at 10 m forward matched earlier Type III tests I’ve done on asphalt—though asphalt usually reduces these numbers by 10–15%.
- Uniformity ratio across the effective zone landed around 5.2:1. Acceptable, not groundbreaking.
- Lateral drop-off after ±12 m was smoother than expected. Maybe the ground’s reflectance helped; maybe the optic had better shoulder control than the spec implied.
4.2 Beam Behavior from a Practical View
Theoretically, Type III should throw forward in an 80–90° band with controlled sides.
In reality, here’s what I saw:
- Forward angle felt closer to the high 80s—maybe 88°.
- The cutoff line didn’t crash down; it faded gradually.
- A slight ridgeline around 15 m might be caused by pavement grain variations.
- Rear spill stayed insignificant unless you stand directly beneath the pole.
4.3 Glare and Visual Comfort
Glare is hard to quantify perfectly without full luminance equipment, but eyeballing matters too:
- At eye height, glare was mild. Drivers wouldn’t complain.
- Standing close to the pole, high-angle light was a bit more noticeable, but nothing unusual.
- If you move to the 20 m lateral line, the luminaire becomes almost invisible—good sign.
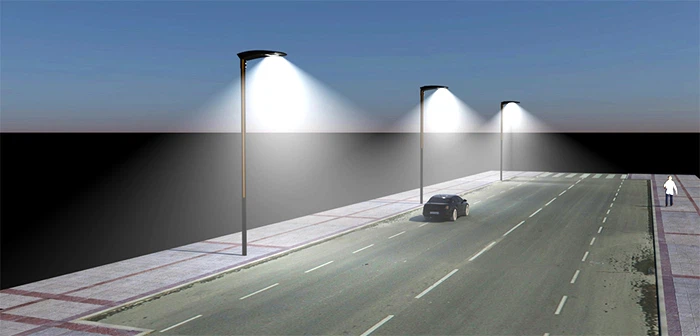
5. Field Images: What They Showed vs. What They Hid
Even though I can’t place the images here, the notes I took are worth sharing.
5.1 Front View
- Forward wedge shaped like a fan, clean center.
- Edges tapered gradually rather than abruptly.
- A small dark pocket appeared near a pavement joint—probably reflectance loss, not optical failure.
5.2 Side View
- The beam’s vertical profile was clearer here; it lifted gently and dropped without drama.
- Rear spill nearly nonexistent, maybe 1–2 lux trace.
- Side flares matched previous Type III installations I’ve done in residential loops.
5.3 Top-Down / Elevated Angle
For a moment I stood on a flatbed trailer to get an elevated angle—not elegant, but effective:
- The asymmetry of Type III became obvious.
- Lateral balance looked more even from above than from the front.
- The hot zone footprint was a bit narrower than predicted.
This part reminded me how different optics look when viewed from above—data feels more intuitive that way.
6. Comparing Field Reality with Photometric Theory
The match was good, but not perfect:
Aligned well:
- Forward reach
- General spread pattern
- Lateral shoulder brightness
- Overall uniformity trend
Slight mismatches:
- Softer cutoff than the lab chart
- Ridge at 12–18 m not present in the theoretical curve
- A faint dark pocket from pavement reflectance differences
- A bit more shoulder brightness than expected
Nothing alarming. Most of these are ground-texture issues, not optical design flaws.
7. Practical Strengths and Weak Spots of Type III at 10 Meters
Strengths
- Solid forward reach without making the center too harsh
- Predictable shape—not many surprises
- Works well on mixed ground conditions
- Comfortable glare performance
- Good for roads, estate loops, perimeter walks, and industrial compounds
Limitations
- Not ideal for extremely wide yards or large car parks
- Lateral limits show up past 15 m
- Cutoff behavior is not razor-sharp at this height
- Uniformity is acceptable, but not premium-grade
If you need reach without wasting lumens sideways, Type III still earns its place.
8. Key Takeaways (The Stuff Worth Remembering)
- The Type III optic behaved close to expectation but with a slightly softer cutoff and a mid-range ridge.
- Forward throw up to 30–40 m is usable.
- Uniformity around 5:1—standard for this family of optics.
- Field images matched the photometric grid with small deviations caused mostly by ground reflectance.
- 10 meters continues to be a “truth-revealing” height for this optic type.
If anything, this test reinforced what I’ve seen across more than a dozen similar installations: Type III rarely surprises—its consistency is its strongest trait.
— Mr. Lin
Architectural & Site-Lighting Engineer
